Monitoring, Research & Data
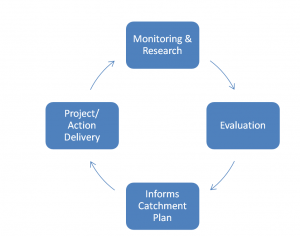
 On-going monitoring and research is an essential part of understanding how our catchments are evolving. It is important for us to understand how the landscape is changing over time, and how our actions are influencing this change. In turn this can inform a targeted delivery of projects based on robust evidence.
The Environment Agency undertake monitoring under the Water Framework Directive (EU Legislation to protect our waterways). They monitor a number of parameters to assess if each waterbody (sub-catchment) within a catchment meets a series of objectives. By 2021 our rivers and lakes are required to meet ‘good status’. This is the most comprehensive dataset that we have. For more information and access to the data please visit the catchment data explorer.
To see a visual, map based display of some of this evidence please visit the monitoring tab under the catchment data portal.
Monitoring Plan

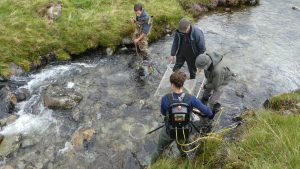
Electrofishing
Please, click here to see a copy of our Monitoring Plan
Please also see our catchment maps, under the Catchment Plan tab for monitoring locations.
Research
We believe strong science is based on good research and evidence and we use this to drive forward projects and to continually review our actions. We would love to hear from you if you have any research proposals or would like to carry out any research in South Cumbria. Check back soon for research (e.g. Msc and undergraduate) opportunities.
Data and Evidence
Electrofishing:
SCRT carry out a yearly monitoring programme (on a three year cycle) to assess fish populations using the electrofishing method. A full report of the results from the 2016 surveys is available below:
You can view all the results on an interactive map.
Riverfly Surveys

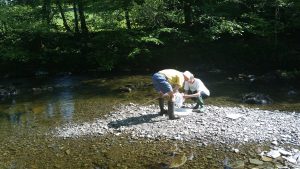
Riverfly Surveys
As part of the National Riverfly Programme SCRT support volunteers to undertake riverfly surveys to assess invertebrate populations as a indicator of water quality.
You can view all results on the SCRT website.
Water Quality Monitoring
The Environment Agency have deployed a sonde at Newby Bridge and Calgarth, data from this can be viewed here. Please accept the terms and conditions, click continue and then you should be able to see a graph for each site.
